Late Winter and Spring weather 2024
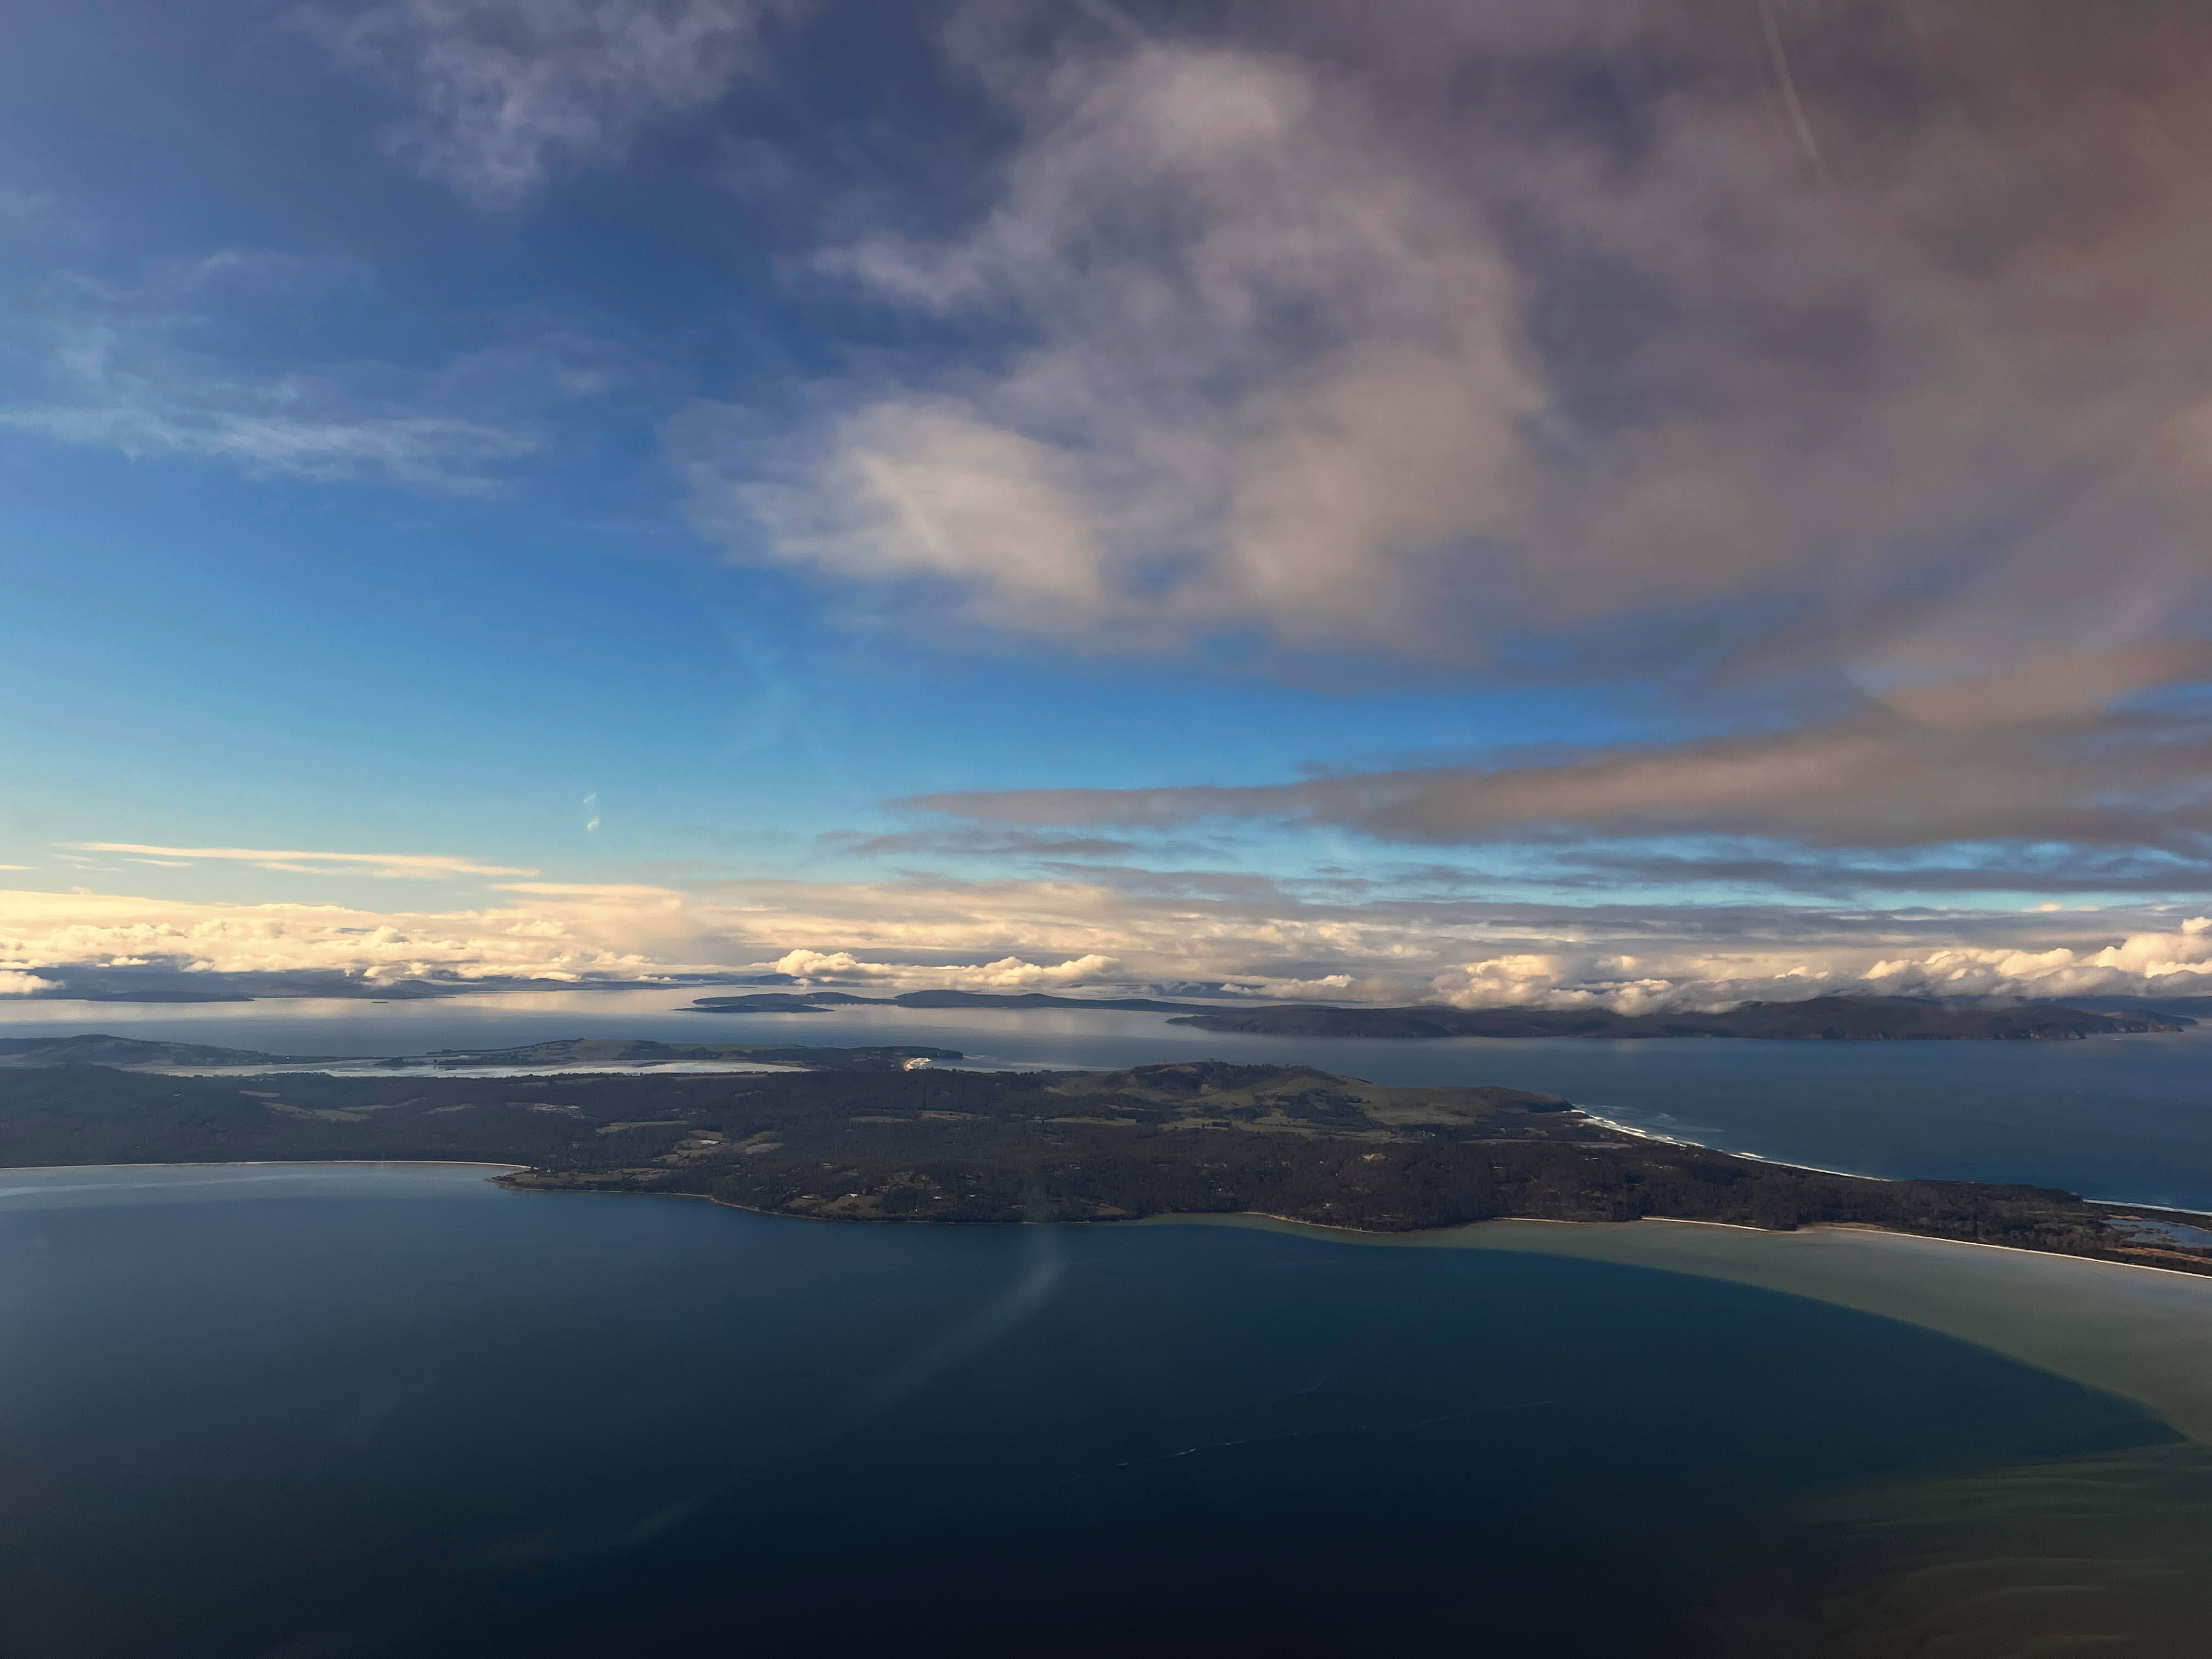
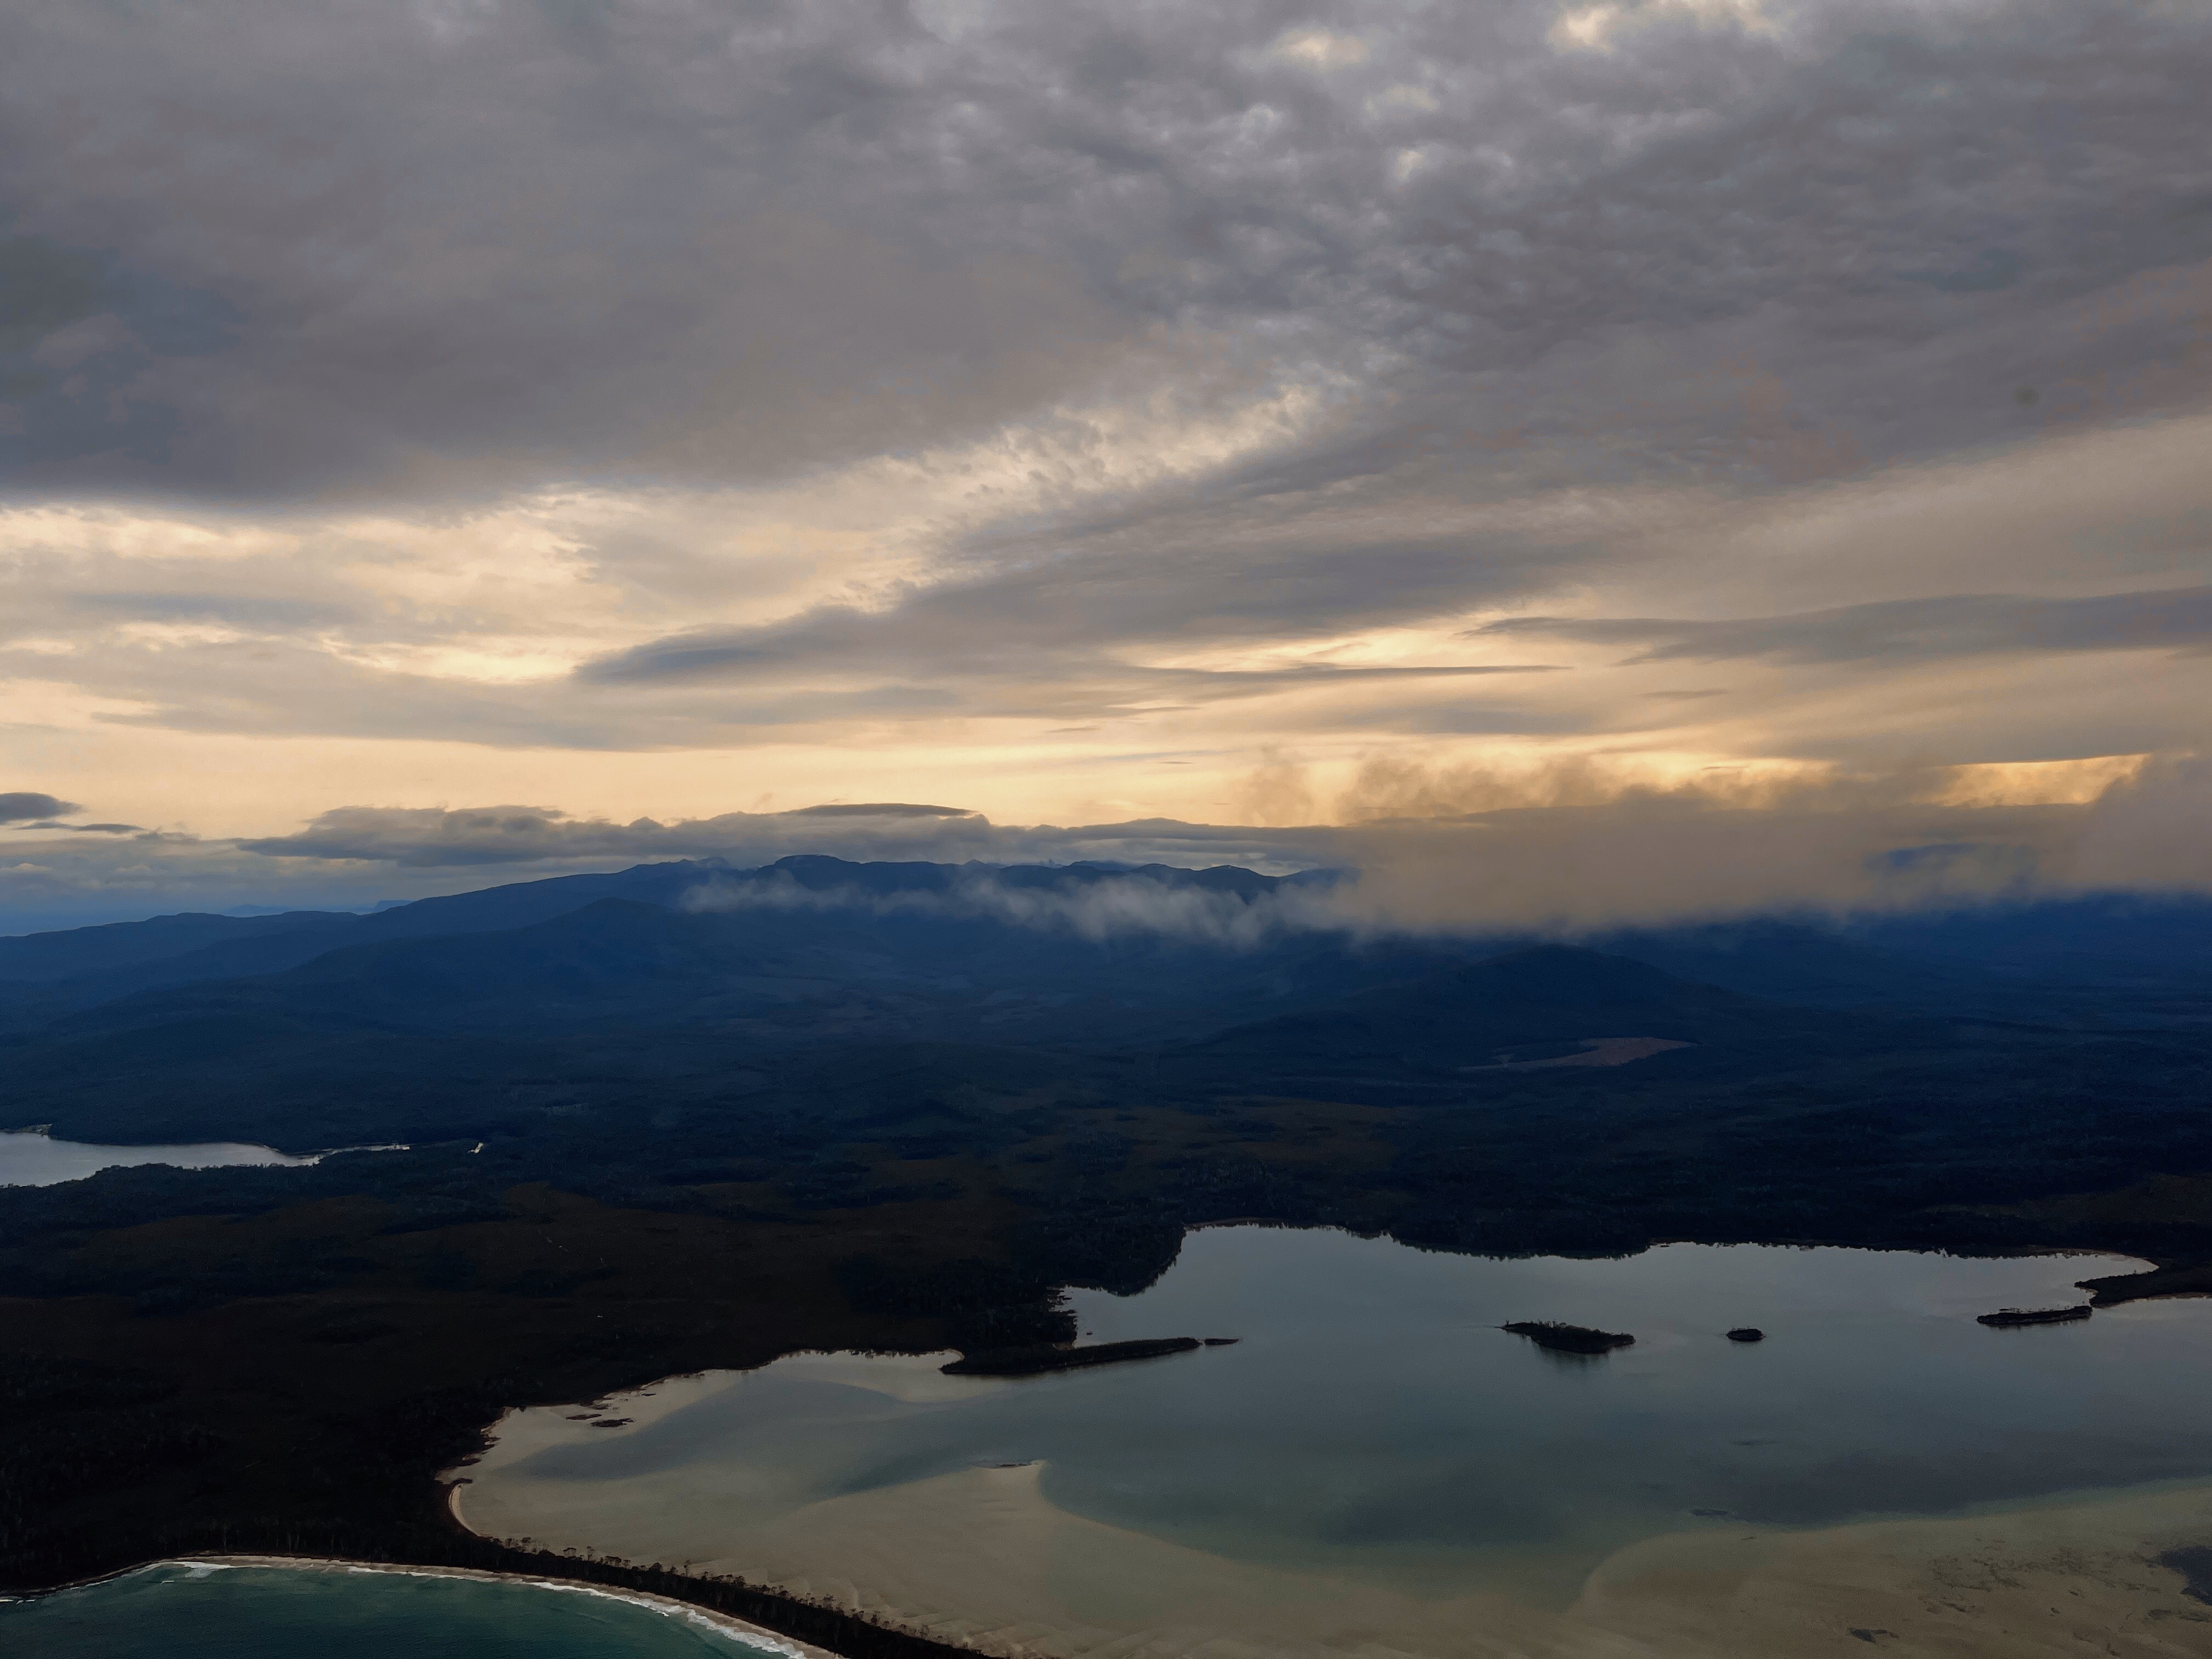
Winter flying weather has been good in Tasmania up until August. August and September have been very different though - a very unsettled period in Tasmania. There has been flooding and damage to homes and infrastructure, and electricity has been cut to some areas for weeks. Some ferry crossings of Bass Strait have had to be delayed (I noticed that the wave rider buoy showed a wave height of 18 metres a few weeks back).
My last flight from Cambridge Airport was in early August and there haven’t been many suitable flying days in southern Tasmania since then. It was timely to do some analysis of the weather we’ve been experiencing to see if it has been as bad as it seems (or worse). For this, I’m using the excellent resource provided by the University of Iowa, which has an archive of automated airport weather observations from around the world. The other excellent source is the Bureau of Meteorology Observations data, from which I extracted the recent data for Hobart Airport.
Analysis of data should include time-series and comparative analysis. Time-series would include comparing Spring 2024 with the same period from previous years. For a comparative analysis, I’ve chosen Rockhampton in Queensland. I selected Rockhampton as my fellow aviation and adventure writer, Andy Hale (Wild Nordics – Adventures, Passions, and Surviving Finland), identified it as having the best climate in Australia.
Wind
The first measure is wind. The roaring 40s has definitely been the reality recently: ‘when the house shakes, you can’t sleep at night, you see the family pet being blown across the back lawn, or the trampoline in an adjoining suburb, you know it’s windy’. There's nothing like a photo of the causeway at Midway Point not far from the Hobart Airport) to show dramatically just how severe the wind has been (see link to the ABC website).
Flying requires more precise information though. For a Cessna 172, the crosswind limit is 15 knots. In the period 1 August 2024 to the most recent available data on 17 September 2024, the severity of the crosswind may have prevented flying a Cessna on 8 days at most (during daylight hours). At our comparison airport of Rockhampton, there were nil days during the same period when crosswinds were experienced greater than the crosswind limit for a Cessna 172 of 15 knots.
In 2023 over the same period, there were only 3 days when crosswind would likely have limited operations of a Cessna 172. So there at least some data to suggest that Spring has been especially windy this year in Hobart.
Overall, however, crosswind was not a significant limiting factor to Spring flying in Tasmania as most days were within the operational limit of 15 knots crosswind. The majority of days had only moderate wind conditions with crosswinds below 10 knots, making them suitable for flying. For example, days such as when I last went flying:
- August 4, 2024: 9 knots
- August 8, 2024: 8 knots
The BOM also maintains data on aerodrome climatologies and these data also show that crosswind is not a major limiting factor at Hobart. It is typically only southerly winds that present issues during August. The total frequency of wind speeds exceeding the crosswind limit of 15 knots for a Cessna 172 at Hobart is 0.8% (see aviation climate). The aviation climatologies are based on records for the period 29 Nov 1984 to 31 Dec 2021 (based on 54211 observations for August).
Wind at ground level, however, does not tell us about what is happening at an altitude where a light aircraft would be flying. Fortunately, we have observations from the summit of Kunanyi Mt Wellington. During August, there were 12 days with wind speeds averaging greater than 30 knots. The maximum wind gust experienced over the month was 93knots or 172km/h. Averaged over the month, maximums recorded were 50knots. At these wind speeds, the aviation weather forecast typically includes notifications of moderate to severe turbulence and mountain waves.
Cloud cover
An analysis was done on Hobart Airport cloud observations for August 2024 and August 2023. Although there was day-to-day variability, the general pattern in Spring 2024 leaned towards more cloud coverage, as evidenced by the median of 7 oktas.
Half of the days in August experienced 7 or more oktas of cloud cover at 9 AM. August 2024 experienced generally more cloud cover than 2023, indicating cloudier mornings overall. The median cloud cover in 2024 was 7 oktas, whereas in 2023 it was 5 oktas. This shows that in 2024, more than half of the days were close to overcast (7 oktas or higher), while in 2023, the distribution was more balanced with fewer days experiencing heavy cloud cover. The 75th percentile was 7 oktas in both years, suggesting that the upper range of cloud cover was similar, with many days experiencing substantial cloud cover in both 2023 and 2024.
Using the University of Iowa data for August 2024 and up until the time of writing on 19 September, there were 9 distinct days where cloud cover was either OVC (overcast), BKN (broken), or SCT (scattered) and the low cloud altitude was below 2,500 feet. There were 5 distinct days where cloud cover was either OVC, BKN, or SCT and the low cloud altitude was below 1,500 feet.
The dates with the worst visibility were as follows:
- August 1, 2024: Visibility 692 meters
- August 15, 2024: Visibility 499 meters.
- August 16, 2024: Visibility 306 meters
I repeated the analysis for Rockhampton. There were 29 distinct days where the cloud cover was either OVC (overcast), BKN (broken), or SCT (scattered) and the low cloud altitude was below 2,500 feet. There were 22 distinct days where the cloud cover was either OVC (overcast), BKN (broken), or SCT (scattered) and the low cloud altitude was below 1,500 feet. The dates with the worst visibility coincided with southeasterly or northeasterly conditions in Rockhampton
- August 21, 2024: Visibility 145 meters.
- August 22, 2024: Visibility 97 meters.
- August 28, 2024: Visibility 97 meters.
- August 30, 2024: Visibility 97 meters.
Synoptic chart
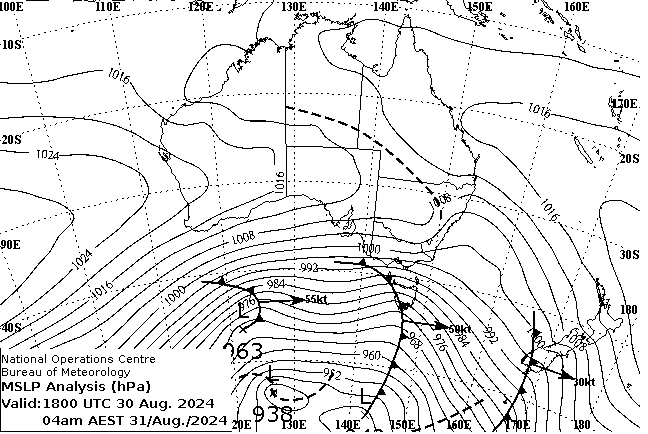
This chart shows the weather that has been quite typical of Spring 2024. It shows a low pressure system with a central pressure appears to be around 938 hPa, which suggests a very strong low, bringing stormy weather with high winds and rainfall in the southern regions of Australia and Tasmania. The isobars indicate very strong winds. The only indication of cloudiness or instability in northern Australia is a trough line. Troughs typically bring instability, which can lead to cloudiness and precipitation, particularly in the tropical regions. The data for Rockhampton does show reduced visibility experienced on 30 August.
The weather experienced in the north and south of Australia frequently has some associations or connections, like the flip side of the same weather coin. A large blocking high pressure system off the east coast of Australia and Tasman Sea contributes to the strong winds over Tasmania and Victoria while also bringing the onshore easterly weather to the north and contributing to the cloudy conditions and lower visibility such as experienced at times in Rockhampton.